| Imaris |
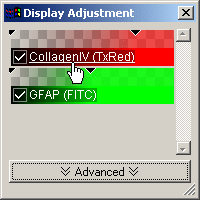
Display Adjustment
|
-
Integrated channel visibility.
-
Open directly channel properties (change base color, etc.)
-
Change simultaneously Image intensity and contrast (left-click & drag).
-
Change Image opacity (right-click & drag).
-
Set automatic range (right-click)
-
Advanced visualisazion with channel histogram
-
Advanced dialog area provides numerical input of min- and max-range, automatic
range, reset range, and change channel opacity
|
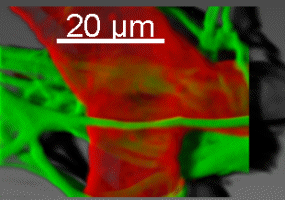
Interactive Scale Bar
|
-
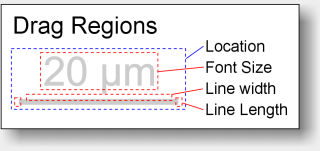
Position and size can be changed.
-
Move the mouse pointer over a drag region. The shape of the mouse pointer
indicates the interaction.
|
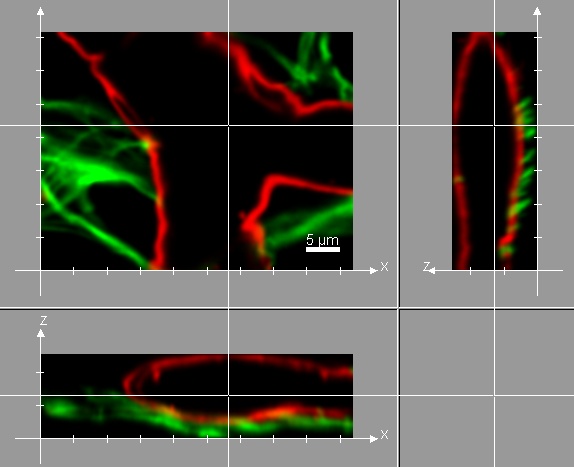
| Coordinate Axis |
-
Coordinate axis indicate data orientation for each view (Slice, Section, Gallery,
Easy3D, Surpass)
-
Open Imaris preferences to activate them (Menu: "Edit / Preferences / Display")
|
Surpass Spots
|
-
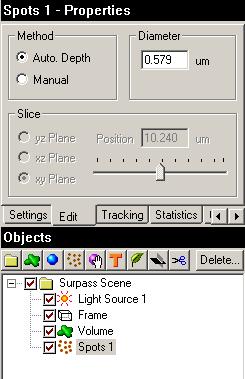
Change spot diameter with mouse wheel.
-
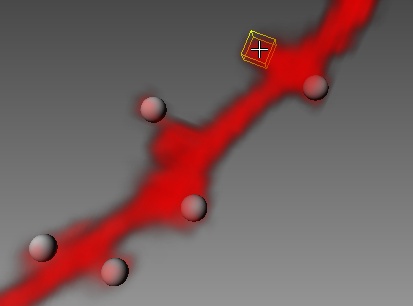
Set spots directly into volume with a simple "shift-click".
The autodepth algorithm searches for the location of the brightest voxel under
the mouse pointer.
|
| Surpass |
-
Volume renderer: Improved rendering quality (reduced opacity jump at certain
angles)
-
Volume renderer: Automatically sets black background in MIP mode.
-
Key frame animation available from main tool bar.

-
Delete Key works also if the input focus is on the Surpass window.
-
Light Source selectively lights objects (like the clipping plane).
-
Time indicator for Surpass view.
|
| General |
-
Image processing: various image progessing thresholds are initialized with range
from display adjustment
-
Full3D view has been removed. The surpass volume produces the same views.
-
Freeware mode has been removed. Imaris can not be started, if there is no
license at all.
-
Various default values (colors, data cache limit, visible surpass buttons, etc.)
have been optimized.
-
Calibration of snapshots for ImageAccess stored in extra tag (Image has now
printig resolution, when imported into Microsoft Word).
-
New program Icons for Imaris application and Imaris documents.
|
| File I/O |
-
Support for FluoView-1000-OIB files (in addition to OIF files).
-
Read time calibration also from: Zeiss Axiovision, Biorad, Lsm510, Olympus
Fluoview, OmeXml, Tiff
|
| Imaris
Time / Measurement Pro |
| Tracking |
-
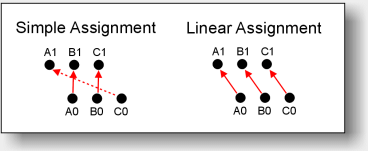
Optimized Tracks with linear assignment algorithm. In some special cases
Imaris' prior simple assignment algorithm could lead to wrong tracks. The
illustration below shows how three objects A, B, and C are tracked from time
point 0 to time point 1. In practice the improvement is difficult to measure.
The number of resulting tracks is about 1% lower and mean lenght of the tracks
about 1% longer. (A nice side effect: the Linear Assignment algorithm
is even a little bit faster)
-
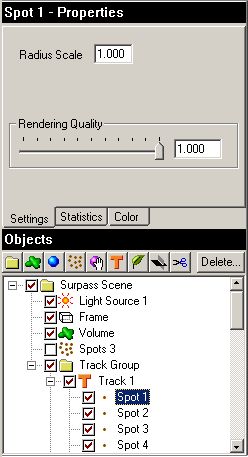
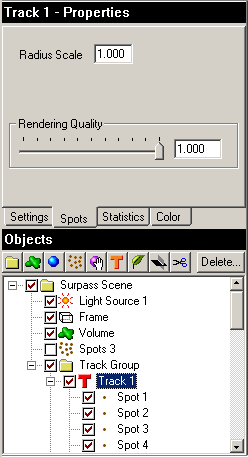
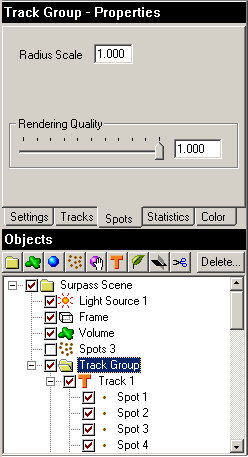
Radius scale and rendering quality for individual Spot objects, Tracks of Spots,
or Groups of Spots.
|
| Measurement Point |
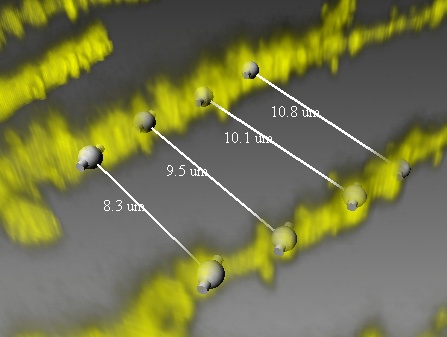
-
Set Measurement Points directly into volume by "shift-click" (autodepth).
|
| Imaris
FilamentTracer |
Filament Draw
|
-
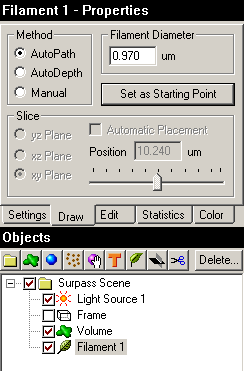
Enhanced semiautomatic draw modes: Autopath, Autodepth, and Manual
-
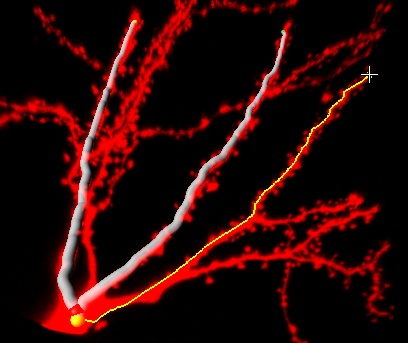
Autopath mode: A starting point (region) is defined by the user (shift &
right-click). As next, the user can point to any location, und the
FilamentTracer computes in real time the shortest path back to starting point (see
yellow path in image below). Pressing shift & left-click adds the current
path to the filament.
-
Autodepth mode: Shift & left-click into the volume and drag the mouse.
Use the mouse wheel to adjust the filament diameter. The algorithm computes the
location of the brightest voxel intensity under the mouse pointer. The current
filament diameter limits the maximum search to prohibit a jump at a crossing
region.
-
Manual mode: This traditional drawing mode shows a drawing plane. Shift &
left-click onto the plane to draw the filament. Use the cursor keys to change
the plane position, or activate the "Automatic placement"
|
| Imaris Coloc |
Automatic thresholding
 |
Coloc P-Value
To test if the observed correlation between the two coloc-channels is "significant
" we compute the distribution of correlation values for random images. We can
then plot the distribution of correlation values and indicate the position of
the observed correlation within this distribution. The following figure shows
such a plot.
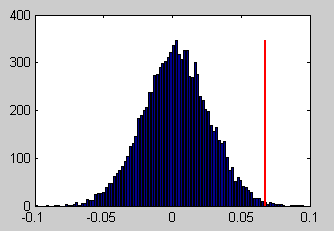
In this case only very few of the random images produce larger correlation
values than the observed correlation. The observed correlation is thus
significant. The P-Value is an indicator of this. It is defined as the ratio of
the area of the histogram to the left of the observed value divided by the total
area of the histogram. P-Values close to 1 indicate significant correlation.
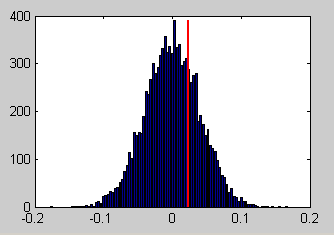
The following figure shows an observed correlation and a distribution of random
correlation-values for a situation where almost ten per cent of the random
values exceed the observed value. It is thus well possible that the observed
correlation is the result of noise alone.
For the P-Value to be meaningful it is necessary to have a valid model of the
background noise of an image as a model to generate random images. This model is
specified via the point spread function. We generate random images in two steps:
First we create white noise images. Then we smooth these with a Gaussian point
spread function of a specified width. The width of the point spread function
must be entered by the user.
(Note that the distribution of correlation values is independent of the mean and
standard deviation of the random image. It is not necessary to estimate these.)
In general, a wider PSF leads to a wider distribution of correlation values and
thus to a smaller P-Value.
Here is how to be conservative:
-
do not preprocess the image
-
overestimate the PSF width
-
require P-values close to 1.
|
| Fixed Bugs (since
Imaris 4.0.6) |
| 615 | Performance Issue in Surpass |
| 695 | side bar display is altered when loading a scene outside surpass |
| 697 | Resample Open: Crop => wrong extends |
| 698 | Rebuild Isosurface changes it's position within surpass tree |
| 616 | Load scene measurement point on position 0 0 0 |
| 627 | Objects to be exported must be check marked |
| 631 | No measurement line if Z coordinate is negative |
| 647 | Old tiff-series reader has a problem with large data sets |
| 657 | Slice distance measurement line not drawn for 2d images |
| 663 | Newest Olympus OIF does not load (error msg) |
| 696 | Track Scene fails |
| 233 | scale bar units lost |
| 529 | Isosurface disappears if Rebuild canceled |
| 578 | Texture defect in Coloc |
| 597 | Display Adjustment window visible in snapshot |
| 614 | 5x5x5 median of 2D image crashes imaris |
| 639 | Not splitted IsoSurfaces invisible after loading scene |
| 650 | Undo does not work if Threshold Cutoff is cancelled |
| 661 | Help Demos discards current dataset without warning |
| 679 | iso surface is computed twice |
| 684 | Black picture in 'Image Properties - Thumbnail' |
| 692 | ip cancel ==> error message |
| 651 | Edge preserving filter produces strange result |
| 662 | Keyframe does not accept camera type change |
| 676 | Online Upgrade 4.0 to 4.1 crashes Imaris |
| 683 | Crash if 'License not found' dialog is canceled |
| 686 | Keyframe Animation does not work with orthographic camera |
| 633 | Temporary files are not deleted when Imaris is closed. |
| 648 | Olympus OIF parameters missing |
| 658 | Panning slice view -> mouse pointer disappears |
| 671 | Windows positions not reset after change of screensize |
| 672 | Check mark set but channel not visible |
| 634 | Time calibration not stored in Imaris 3 format |
| Feedback |
|
Any feedback on the installation, and the usage of the Beta products listed
above are more than welcome! Please send your comments directly to the product
management (
messerli@bitplane.com
)
|


